Why Track Mobile App Metrics?
Measuring mobile app analytics is crucial especially if you are developing an app for business. Of all the metrics that can be tracked regarding the use of a mobile device, understanding mobile metrics gives you insight into the use of your app, the frequency of use, and the aspects that may need a tweak. This brings a lot of understanding when it comes to making decisions on how to enhance the results of the application and engagement of users.
The lack of app metrics creates problems for enterprises not only in the competitive app economy but also in terms of lost opportunities for revenue acquisition. Without metrics, you will also lack the data for evaluating the success of your app and as well as determining whether you are on track to achieving set goals. This can result in resource wastage and poor app marketing plans.
How to Track Mobile App Metrics
Today, there is an opportunity to track iOS and Android mobile app statistics with the help of Google Analytics.
Before you can begin tracking your mobile app metrics you’ll need to have Google Analytics initially set up and create a new property for your app. It will also be necessary to include the Google Analytics SDK in your mobile application code. Last of all, you will have to define all of the markers that you want to see in your Google Analytics.
This way you will be able to analyze the data after tracking in the Google Analytics dashboard is set up. From the data, you would have been able to identify areas that require changes in terms of interface design, marketing, and the general revenue model. As such, to guarantee the success of your app, it is possible to use the data to find out various tendencies that will help make correct decisions in the future.
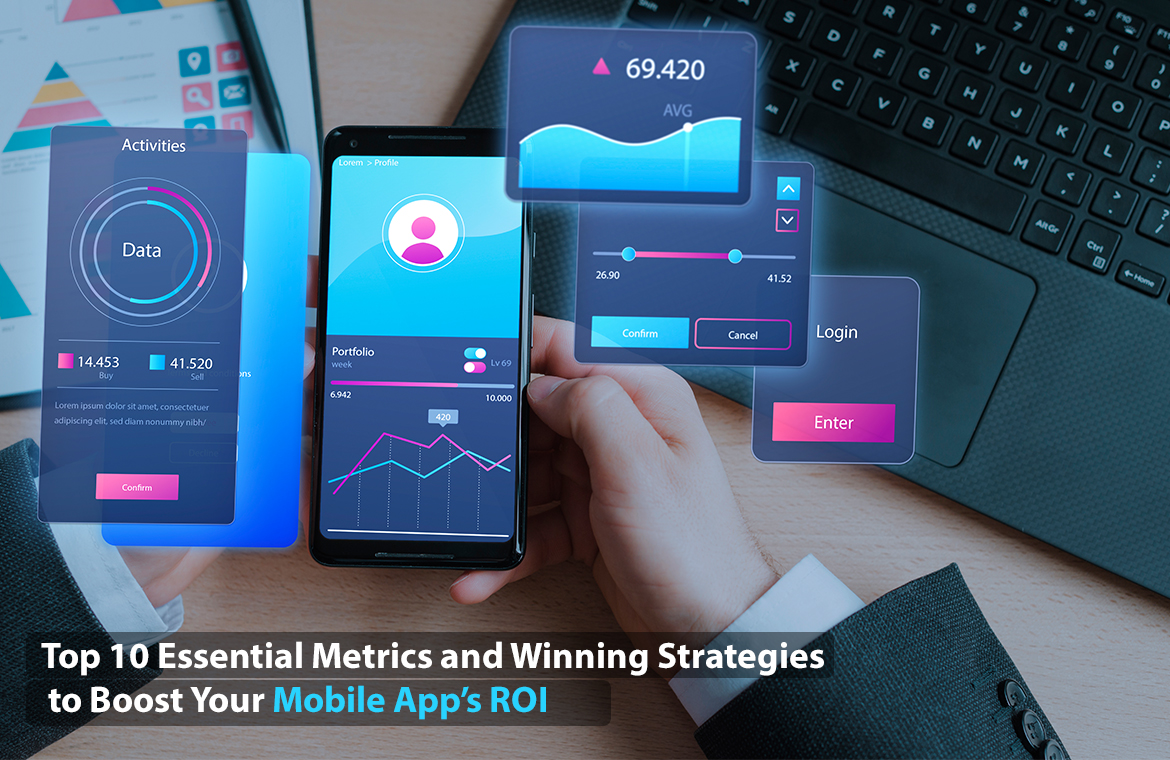
In this blog post, we would like to pay attention to the 10 mobile app KPIs and engagement metrics that every business should consider while evaluating the performance of its app. However, even at the development of MVP, there must be a prior look at these indicators.
There are countless metrics that you can measure when it comes to your mobile app performance, user engagement, as well as revenue. The objectives will also vary from one app to the other depending on the area of focus and including but not limited to the goals like improving engagement rates, or revenue generation. Thus, it is impossible to identify specific key performance indicators to track for your mobile app without taking into account its purpose, the users’ path, and corresponding industries.

Here are the list of 10 key app metrics to consider:
1. Number of App Downloads
Several app downloads define what number of unique devices using your mobile app development or downloading it.
The download count is one of the key values of the application since this metric shows how many people use the mobile application and how effective the reviewed campaigns for stimulating downloads are. The download allows you to analyze the number of downloads made through specific promotion channels including social media and app store listing. Such information can be useful in determining which channels are the most effective for marketing your app and, therefore, in optimizing your marketing approaches.
For Apple devices, the number of downloads of the app can also be observed through the Google Play Store and Apple Store. If you have developed the cross-platform app ensure that you are tracking the app download in both stores. The features of your app, including the icon used as well as the keywords in the description you provide need to be maximized to ensure you have the clients How to increase the number of downloads of your specific app in every store?
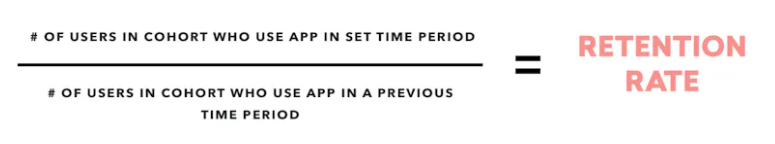
2. Retention rate
The retention rate calculates the number of times users return to the app after the initial visit. It is in terms of percentages that the measurement is carried out. This is a significant parameter because, to be vulnerable, it will be possible to lose users only at the initial stage – upon their first visit. A low retention rate suggests that users did not have the best app utilization and could not find any utility in your application.
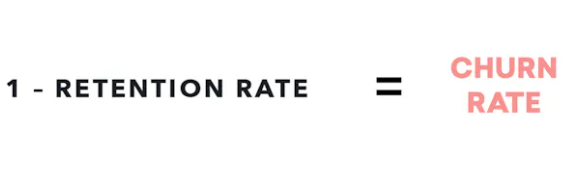
3. Churn rate
The churn rate is the ratio that shows how many customers remain your app’s customers or continue to patronize the app. It is a percentage of those who cease to patronize your product or services making a certain period. This metric is one of the most popular mobile app KPIs and defines the level of customer satisfaction. If retention rate higher percentages a sign, then in this case it turns out to be a problem of customer service and quality of products.
4. Monthly active users
Monthly Active Users (MAUs) is a way how to share the percentage of those users who use the app during one month. For example, they may log into an application, share information on social media, or shop online. MAUs are normally concluded at the end of the month and are a useful measure in assessing the state of digital property. This one is applied to measure shifts in user activity, analyze the results of a new product or service launch, and monitor the competition.

5. Daily active users
DAUS stands for Daily Active Users, and what this is, is how many times a day actual users are interacting with a specific application. For instance, the user accesses a certain website and performs a given function on a given day. This metric is also a good indication of the health of the specific App particularly that of the App hosting the Games. Tracking the increase in growth and popularity of the application is possible using the aforementioned feature.
This proves your use of the application and it can be used in coming up with a pattern of user behavior. Of course, this can turn into additional amounts of revenue through the products’ selling inside the application or advertising revenue.
If and when businesses monitor DAU over time and compare this with industry averages, businesses gain the ability to measure the growth and shift in the users and as a result make better decisions which thus in turn increases engagement and retention.
6. Number of sessions per Daily Active User
Frequency of use in this context is an indicator represented by the number of user launches of your App on a particular day. It assists users in knowing how often users are engaging the application and helps business organizations determine this as well. Of course, increased sessions per DAU indicate high satisfaction among the users. If for instance, this metric is to be improved, the best way would be to post more personal content. It can be achieved using big data and artificial neural networks to make the analysis more efficient. Companies can know the needs and interests of the audience and deliver content according to their choice.
7. Average session length
Average session length is a metric that quantifies the extent of time that a user spends using an app in one session. This is true because it is clear that the longer a user spends a certain amount of time on an app, the more value he is likely to derive from the said app. It also, shows they are taking more time to search within various aspects of the offer. It could be helpful on the side of the business to have a clue on the topic area that the users find most engaging.
8. Customer Acquisition Cost (CAC)
Why It Matters
Customer Acquisition Cost (CAC) reflects the expenses needed to acquire each new user via marketing. Lower CAC signifies that efficiency in targeting and converting the users has improved thus increasing ROI.
How to Measure
CAC or Customer Acquisition Cost = Total Marketing Expenditure / Number of New User Gained. Marketing analytics platforms should be used as a means of tracking the effectiveness of the campaigns.
Winning Strategy
Increase its efficiency by emphasizing paid traffic and targeting only users that are more likely to purchase a service, use a product, or make a donation, etc.; Avoid paid advertising and relying on the traffic coming from using content marketing and SEO strategies. Partner with other influencers or blogs, which are specific to a particular industry, to cut down on the amount spent on paid ads.
9. App Store Optimization (ASO)
Why It Matters
Organic downloads are among the several benefits users experience when they choose to tap into the services offered by ASO as it increases the app’s discoverability in the app stores. The two models illustrate how optimization of the app store can drastically help in cutting down the CAC and thus boosting the overall ROI.
How to Measure
Monitor keyword positions and download rates as well as view install rates both in the Apple App Store and Google Play Store.
Winning Strategy
And when naming the app, it’s recommendable to incorporate keywords such as “mobile app development company”. To enhance user experience, you need to update your listing frequently in response to suggestions from the users and concerning the changing seasons. There is a need to promote positive reviews and ratings to enhance rankings.
10. Net Promoter Score (NPS)
Why It Matters
NPS is a tool for estimating customer loyalty and satisfaction and helps to define the readiness of mobile application users to recommend your application to others. This results in word-of-mouth publicity hence downloading the product without the extra spending on advertising.
How to Measure
Survey users using a simple question: “How likely are you likely to recommend this app to a friend?The NPS = (% of promoter – % of detractor) where % of promoter = (% of respondent those who given 9 & 10) and % of detractor = (% of respondent those who given 0 to 6)
Winning Strategy
Engage the promoters with programs that are aimed at referral, or incentives. At the same time, it is possible to respond to numerous complaints of the application’s detractors and minimize the negative outcomes for the overall application’s reputation.
Conclusion
Consequently, monitoring the Mobile app KPIs and the engagement indicators is a crucial step for any app-based business. It can be largely a make or mar factor to the specific app in question. In your opinion, if you were to be asked what is the ultimate factor among these mobile app KPIs, you would be quick to reply — the ROI. Therefore, have that in mind because this metric is the final measure of your app’s profitability.
FAQ’s
1. What is the most important metric to track for app success?
All figures are significant, but the most critical is frequently the user retention rate because it shows the overall value of products and consistent users.
2. How often should I update my app?
The frequency of updates also frequently plays an important role in keeping the user engaged and fixing bugs. For one, the update should be major at least once within 1-3 months depending on users’ feedback.
3. What’s a good retention rate for a mobile app?
As with several installs, the user acquisition cost is a lot higher for games that manage to convert a good number of users on the first day benchmarks include Day 1 retention of 30-40% and Day 30 of 15-20%, although some verticals such as card games can be even better at it.
4. How do I improve my app’s user engagement?
Improve user experience by allowing choosing content, receiving push notifications, and in-app bonuses. A touch of fun and constant upgrade is also possible through gamification.
Also Read: Why Digital Marketing is Essential for Business Growth in India’s Booming Economy